2026 Top 50 Builders:
Regional Breakdown
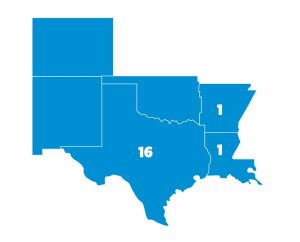
This map shows the distribution of the 2026 PSN and Hayward Top 50 Builders across the country. Numbers on the map indicate how many builders are headquartered in the corresponding state. Each region’s vital stats can be found below.
With a large disparity in representation among the regions, it’s impossible to truly compare them based on the raw data. With that in mind, the following pages also include charts comparing averages for the regions, to get a better sense of the differences between top builders in the various locales.
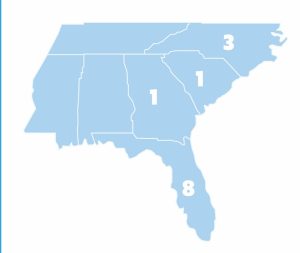
SOUTHEAST
Total Builders: 13
Locations: 32
Employees: 857
Excavations in 2025: 2,944
2025 Total Revenue: $457,387,266
2025 Total Residential Construction Revenue: $373,880,948
- New Residential Construction: $825,114,275
- Renovation: $48,766,673

NORTHEAST/MID-ATLANTIC
Total Builders: 12
Locations: 35
Employees: 921
Excavations in 2025: 1,346
2025 Total Revenue: $336,351,469
2025 Total Residential Construction Revenue: $210,349,967
- New Residential Construction: $183,960,291
- Renovation: $26,389,676

MIDWEST
Total Builders: 4
Locations: 4
Employees: 102
Excavations in 2025: 2,107
2025 Total Revenue: $39,692,885
2025 Total Residential Construction Revenue: $22,168,690
- New Residential Construction: $18,290,104
- Renovation: $3,878,586
SOUTHWEST
Total Builders: 18
Locations: 47
Employees: 1,684
Excavations in 2025: 3,752
2025 Total Revenue: $757,018,305
2025 Total Residential Construction Revenue: $578,187,519
- New Residential Construction: $501,490,769
- Renovation: $76,696,750

WEST
Total Builders: 3
Locations: 6
Employees: 605
Excavations in 2025: 658
2025 Total Revenue: $198,678,205
2025 Total Residential Construction Revenue: $122,285,083
- New Residential Construction: $60,283,749
- Renovation: $62,001,334
Law of Averages
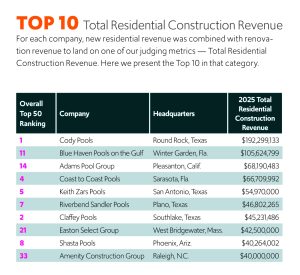
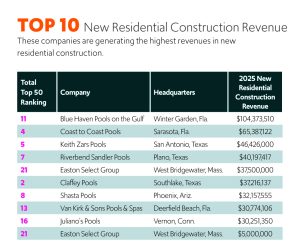
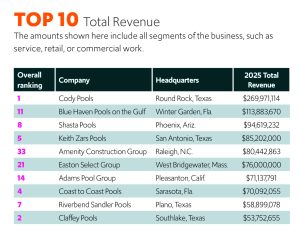
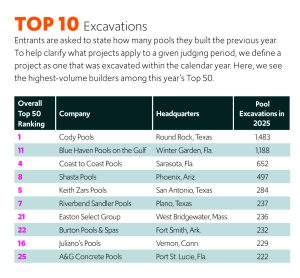
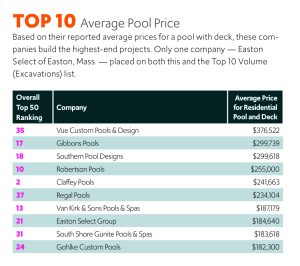
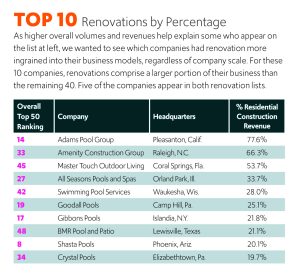
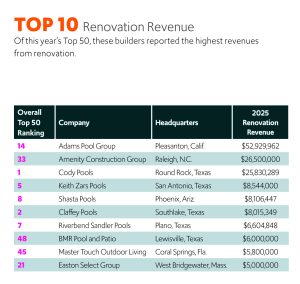
Cream of the Cream of the Crop
Among an already elite group of builders, these companies stood out for factors such as their revenues, average contract prices, volume, and quality of websites. Here, we look at the Top 10 in various categories, showing such things as who’s earning the most, building the most, billing the most per project, and incorporating renovation most tightly into their business models.