While the industry has shown an upsurge since the Great Recession, its growth doesn’t seem proportional with other sectors, particularly housing.
That’s the conclusion drawn from data provided by the economists and analysts with Metrostudy, the business intelligence arm of Pool & Spa News owner Hanley Wood.
In addition to tracking construction permits, Metrostudy has developed an index to monitor activity in the vast majority of the country, taking into consideration a number of factors. While it shows that growth is not coming as quickly as some might hope, predictions remain positive for an upcurve over the next few years.
Here’s a look at the model and the data it has yielded so far. Pool & Spa News will provide occasional updates.
IN THE WORKS
The issue of statistics has always proven a thorn in this industry’s side.
Because of the different ways that permits are processed around the country, there is no reliable government-sanctioned agency that offers consistent numbers. Some areas don’t even require permits to build pools and spas, while others issue general remodeling documentation without recording the type of construction being undertaken. And, because of competitive concerns, many firms within the industry are loathe to give up their intel.
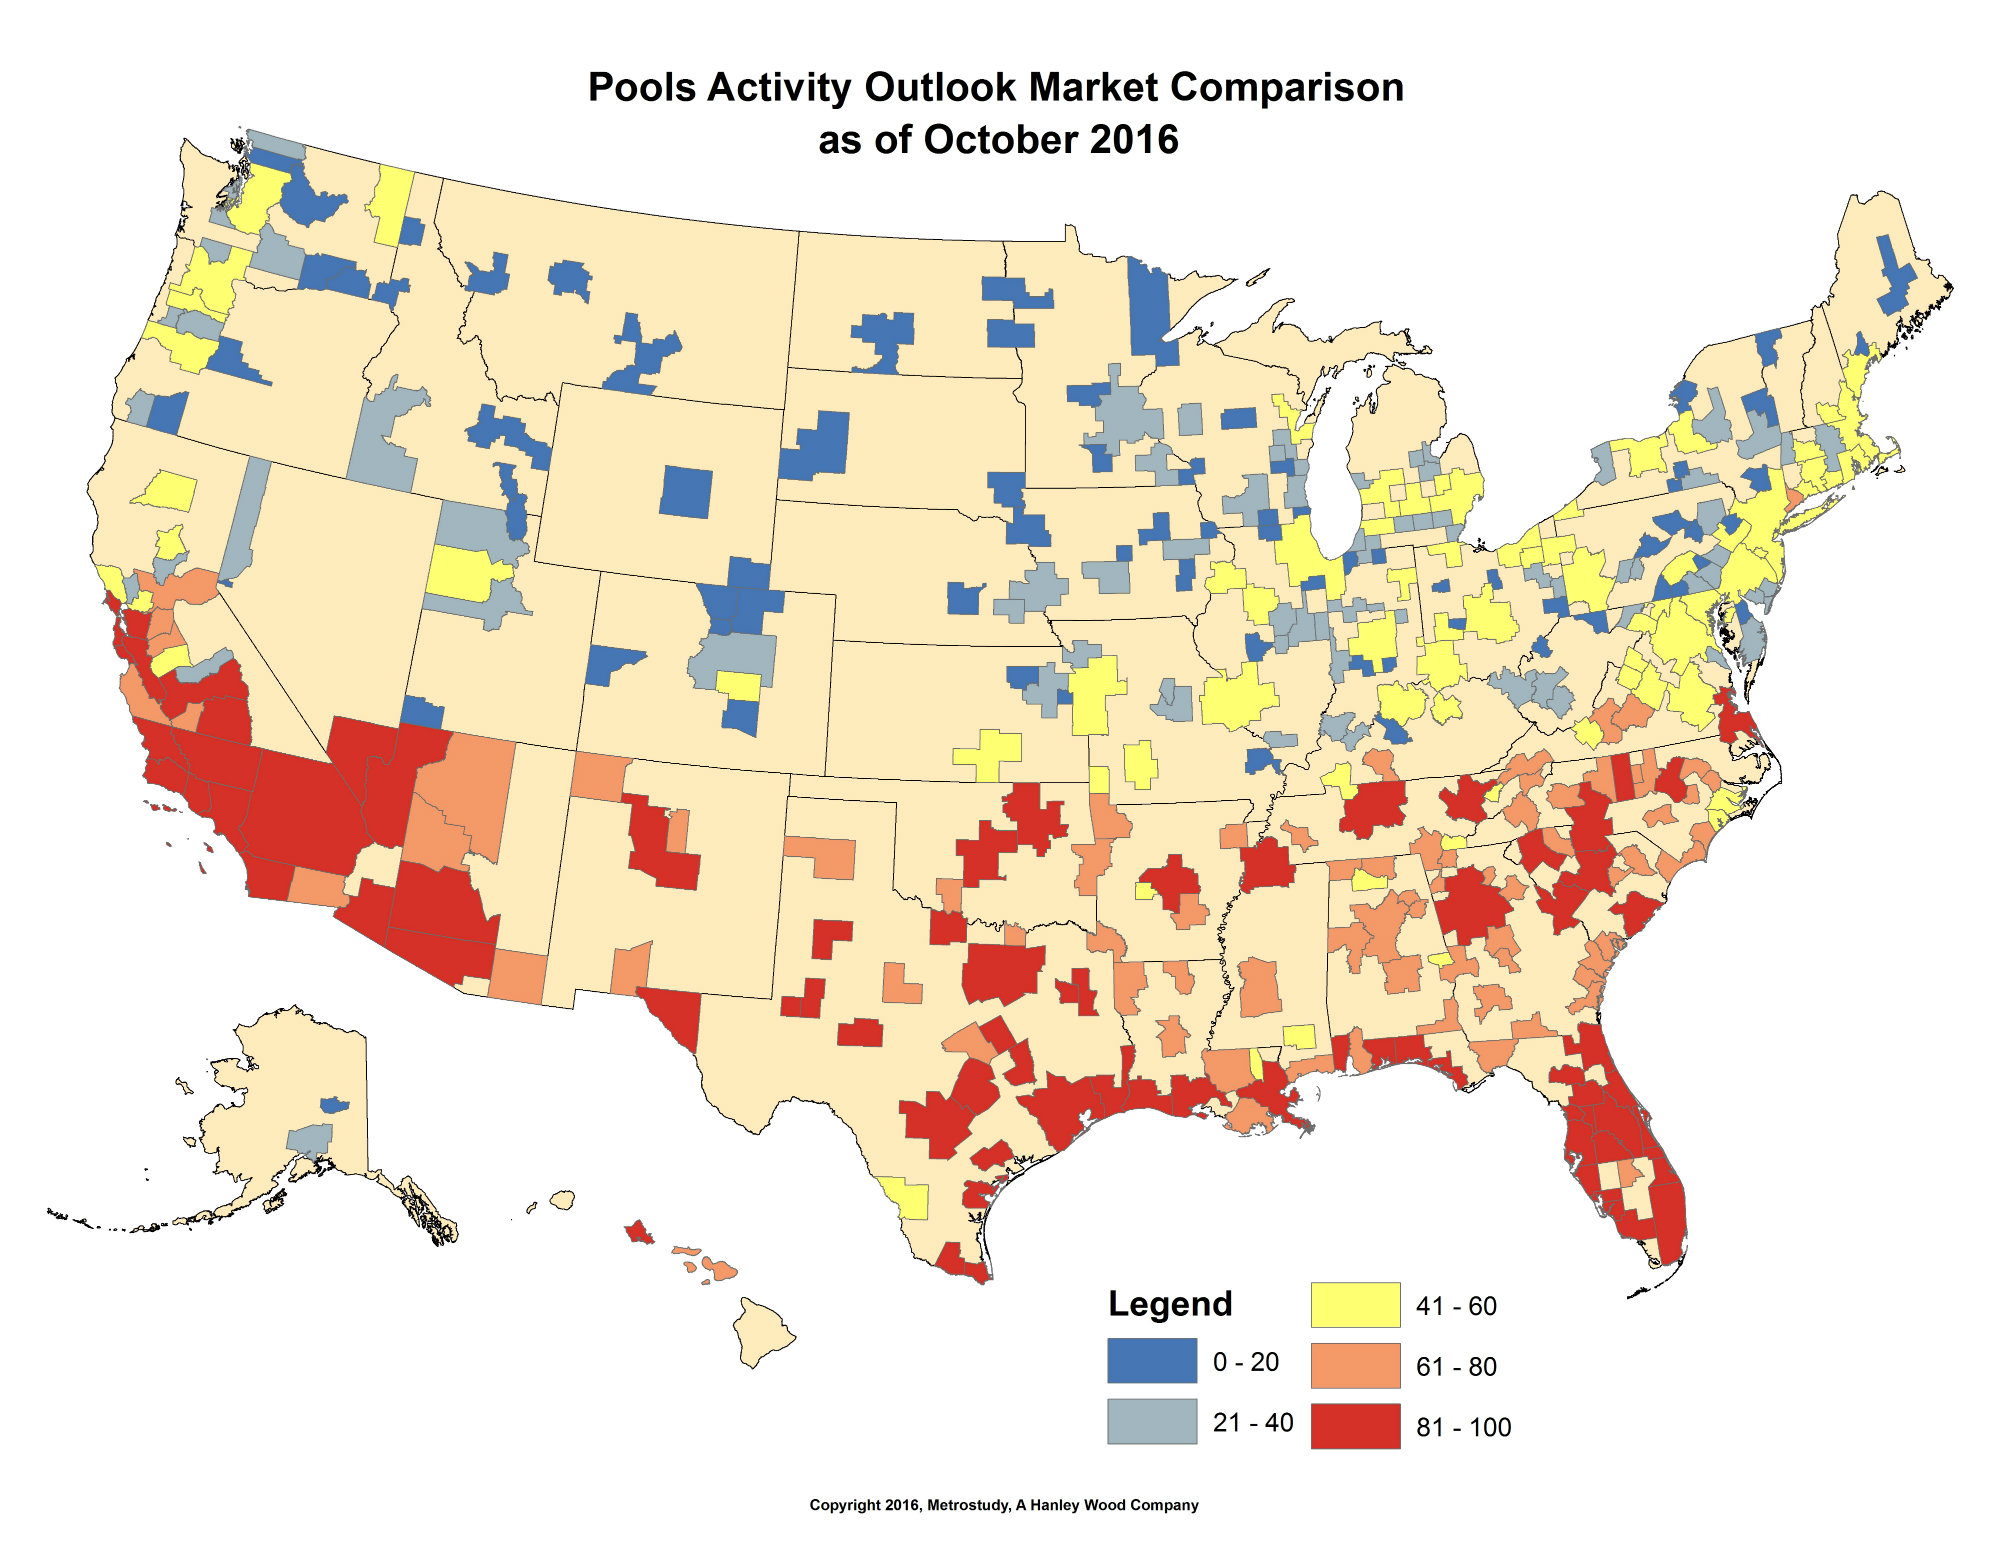
It is hoped a new report will help with the effort to accurately monitor and forecast industry activity on a national and local level. Metrostudy is tracking and researching 381 markets in the U.S., accounting for just about all areas except small rural ones with few pools.
To do this, analysts will look at several data points from a number of sources. Included are permit figures, tax assessor information showing who owns pools, home sales, unemployment rates, reports from consumers and other indicators. This will enable Metrostudy to assess new construction and the number of existing inground pools, as well as make forecasts about upcoming years and supply detailed information about the consumers in each market they study.
By considering these variables, specialists expect to provide more reliable information than would be offered by raw statistics, said Jonathan Dienhart, director of custom services and published research with the Irvine, Calif.-based operation.
“We’ve been trying to serve the pool market for some time,” he said. “As we’ve gained more and more experience, it’s really become evident that trying to rely on a single source of information for the pool market is simply not sufficient. It never paints the full picture. So we decided to take a different tack here.”
They believed it necessary because trends and activity aren’t the same for the pool industry as for home construction. Inground pool and spa construction tends to be more volatile, with higher peaks and lower troughs, and is influenced by different variables.
Metrostudy will update its information throughout the year and make more detailed data available to subscribers on a quarterly basis.
BEHIND THE SCENES
In its analytics model, Metrostudy has introduced a type of statistic that’s new to this industry: the U.S. Pool Markets National Index.
This figure works not as a raw number but as a comparator, showing how activity stacks up with other time periods. To start, the professionals mapped out industry activity over the past several years to determine when movement was highest (2007) and lowest (2009). This provided a baseline against which to compare.
The index number works roughly like a percentage, showing how much activity a year had relative to the industry’s high point in 2007, which is reflected by the number 100. For other years, the number above or below 100 indicates the percentage increase or decrease. So an index of 120 would indicate that activity exceeded the 2007 baseline by 20 percent. Conversely, an 80 would mean it was 20 percent lower.
This figure will be used to track past activity and communicate forecasts.
WHAT WE KNOW
So far, the data confirms what many pool/spa professionals have witnessed: The market is recovering, but slowly.
The projected index for 2016 is approximately 36, with a modest increase forecast for 2017, to about 38.
Metrostudy has released other data as well. It expects a 4-percent increase in the number of inground pools built next year, to approximately 60,510.
The analysts also rank markets. As of third quarter 2016, these areas proved the top pool markets, in descending order: Houston; Austin; Dallas/Fort Worth; Cape Coral-Fort Meyers, Fla.; San Diego; San Antonio; Jacksonville, Fla.; the Palm Bay/Melbourne, Fla.; Phoenix; and Los Angeles. Metrostudy provides more detailed descriptions of these markets.
Metrostudy also has long monitored home construction and remodeling. And the news is good on that front. The analysts expect next year to be the strongest in residential spending since 2006, rising 6 percent to about $680 billion across the single-family and multifamily categories.
According to the U.S. Department of Commerce and Metrostudy, 2015 saw 1.1 million single-family and multifamily starts, and 2016 is projected to show a 7-percent increase. Next year, the analysts expect an 11-percent jump to 1.265 million starts.
The multifamily sector has recovered but is expected to slow slightly in 2017, with starts dropping 5 percent to just under 400,000.
The home remodeling and replacement side is expected to sway positively next year, with a 4.2-percent increase to more than 11.9 million projects.
The top five home construction markets in the third quarter of 2016 were Denver; Boise City, Idaho; Sarasota, Fla.; Salt Lake City; and Phoenix, in descending order.
DRILLING DOWN
In addition, industry companies can purchase reports tailored to their needs. Manufacturers can subscribe to national reports, while builders can buy data on their own market territories.
Historical and forecasted inground-pool figures will be offerd down to the county level, while existing counts will be provided down to the zip code. Consumer segmentation information in each zip code also will be provided.