
PSN wanted to track performance over the last five years, but the Top 50 Builders list changes each year. For this reason, we couldn’t reflect actual changes comparing one year’s list to the next.
To provide a consistent sample, we isolated the companies that appeared on each list from 2020 to 2024 and tracked their performance as a group. The companies can be seen below. Some have been on the list since before 2019.
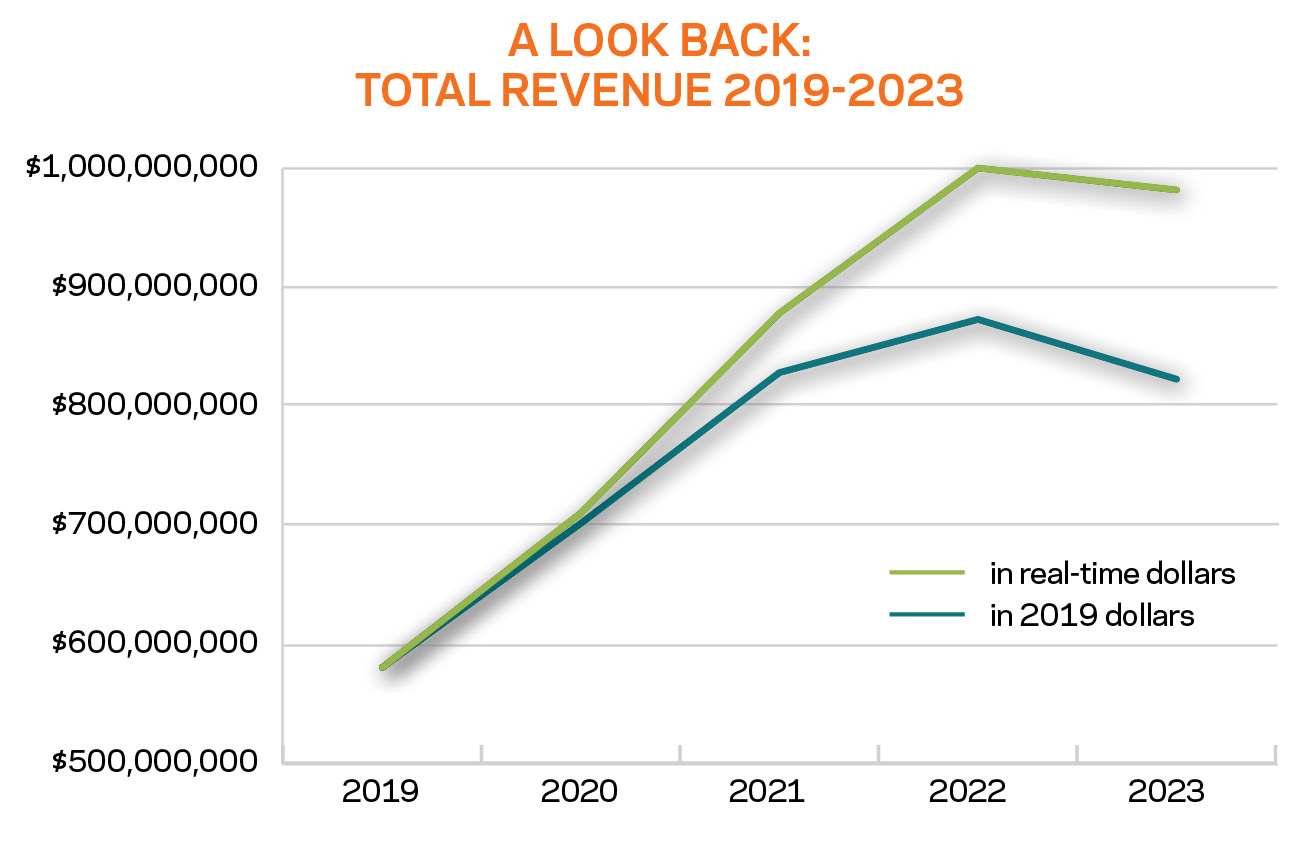
To account for inflation, these results are shown in dollar amounts of the year in question, as well as in 2019 dollars. This was done in the hopes of comparing like with like, though it can’t take into account the various ways inflation has affected performance.
Included in the results: Cody Pools, Round Rock, Texas; Gib-San Pool & Landscape Creations, Toronto; Keith Zars Pools, San Antonio; Claffey Pools, Southlake, Texas; Aqua Pool Patio, East Windsor, Conn.; Goodall Pools, Camp Hill, Pa.; Riverbend Sandler Pools, Plano, Texas; Juliano’s Pools, Vernon, Conn.; Morehead Pools, Shreveport, La.; Van Kirk & Sons Pools & Spas, Deerfield Beach, Fla.; Rising Sun Pools & Spas, Raleigh, N.C.; Robertson Pools, Coppell, Texas; Coast to Coast Pools, Sarasota, Fla.; Regal Pools, Tomball, Texas; Gohlke Pools, Denton, Texas; Arvidson Pools & Spas, Crystal Lake, Ill.; Easton Pool & Spa, Easton, Mass.; Fronheiser Pools, Bally, Pa.; Concord Pools & Spas, Latham, N.Y.; Pulliam Pools, Forth Worth, Texas; and Nejame & Sons, Danbury, Conn.
Like so many in the industry, this group saw a peak in 2022. While 2022 to 2023 seems fairly stable, the drop is slightly more pronounced in 2019 dollars.

For these companies, the trends for residential construction revenue are very similar to those of total revenues.

The COVID bubble can be seen in full force here, with sales peaking drastically in 2022. However, the up-trends are less steep in 2019 dollars.
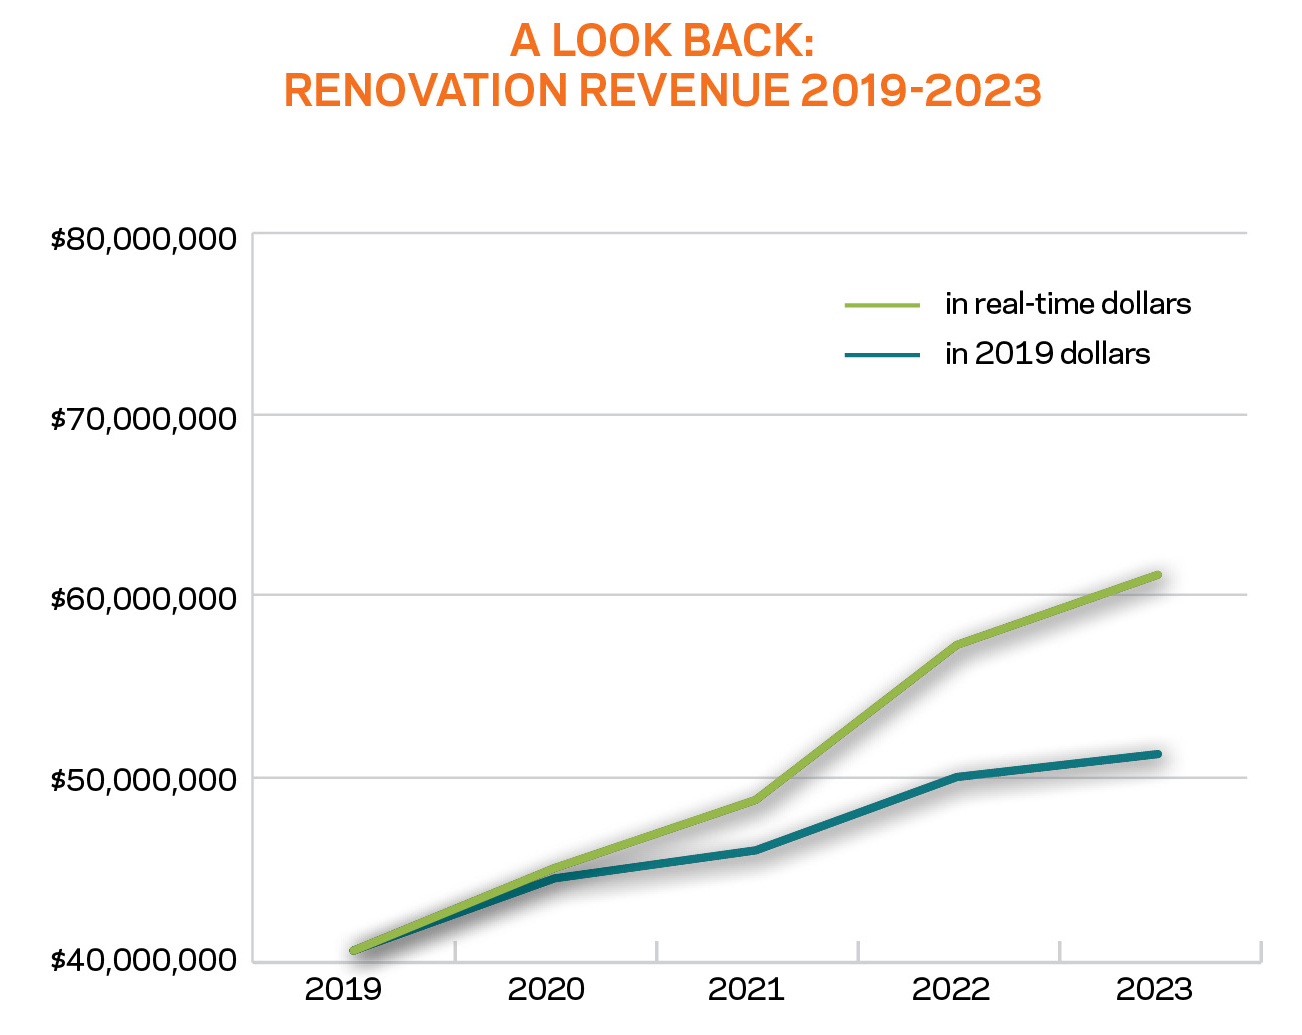
Different from the previous trends, we see here that renovations were still on an incline last year. The builders reported $61.2 million in renovation revenue last year, compared with $57.3 million in 2022. This reflects an almost 7% uptick.
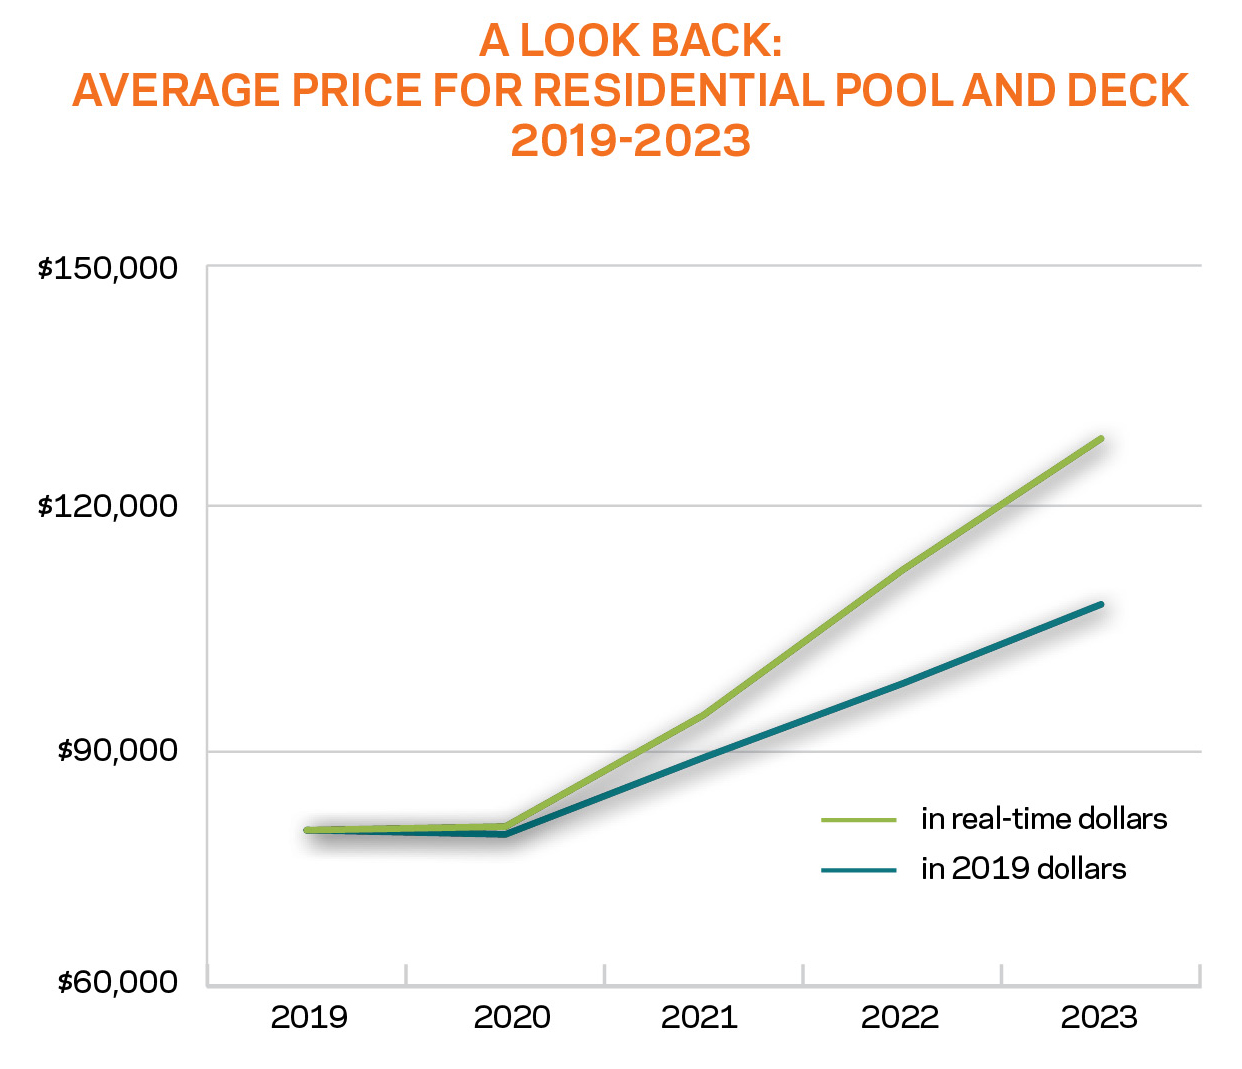
Despite the downtick in revenues seen in 2022, the average contract price for a pool and deck continued to go up. While materials and labor costs may have contributed to this, builders also anecdotally report including more in their projects.
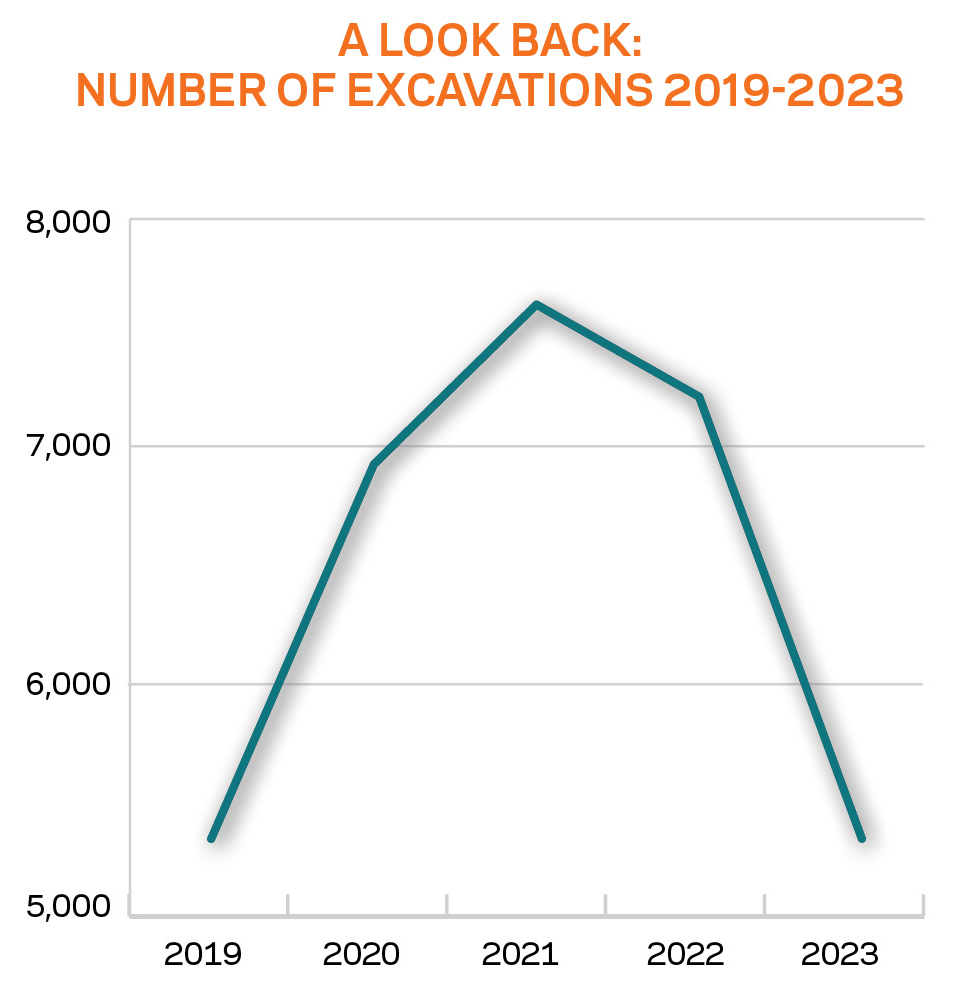
Some define success as maintining levels from 2019, before the COVID bubble. The trend couldn’t be more well-defined than above: The builders in our sample saw almost the exact same number of digs in 2023 (5,316) as they did in 2019 (5,315).

Staffing growth reflected the incline seen in revenues during the pandemic years. Since reaching the COVID-induced peak in 2021, the companies have retained almost the same number of employees, with 2,416 this year, compared with 2,432 in 2023.