Especially considering the unusual times in which we currently live and work, I couldn’t pass up the opportunity to compare how builders have evolved over the past few years.
But, given that the list changes every year, I couldn’t compare the entire Top 50 from year to year. That would be like comparing oranges with tangerines. To provide a consistent sample, I identified the companies that have placed among the Top 50 Builders for the last five years in a row, then tracked key statistics for that group for the last five years.
Below, find out which companies have been on the list for at least the last five years in a row, as well as how such things as sales volume, total revenue and staff size have progressed over the last five years.
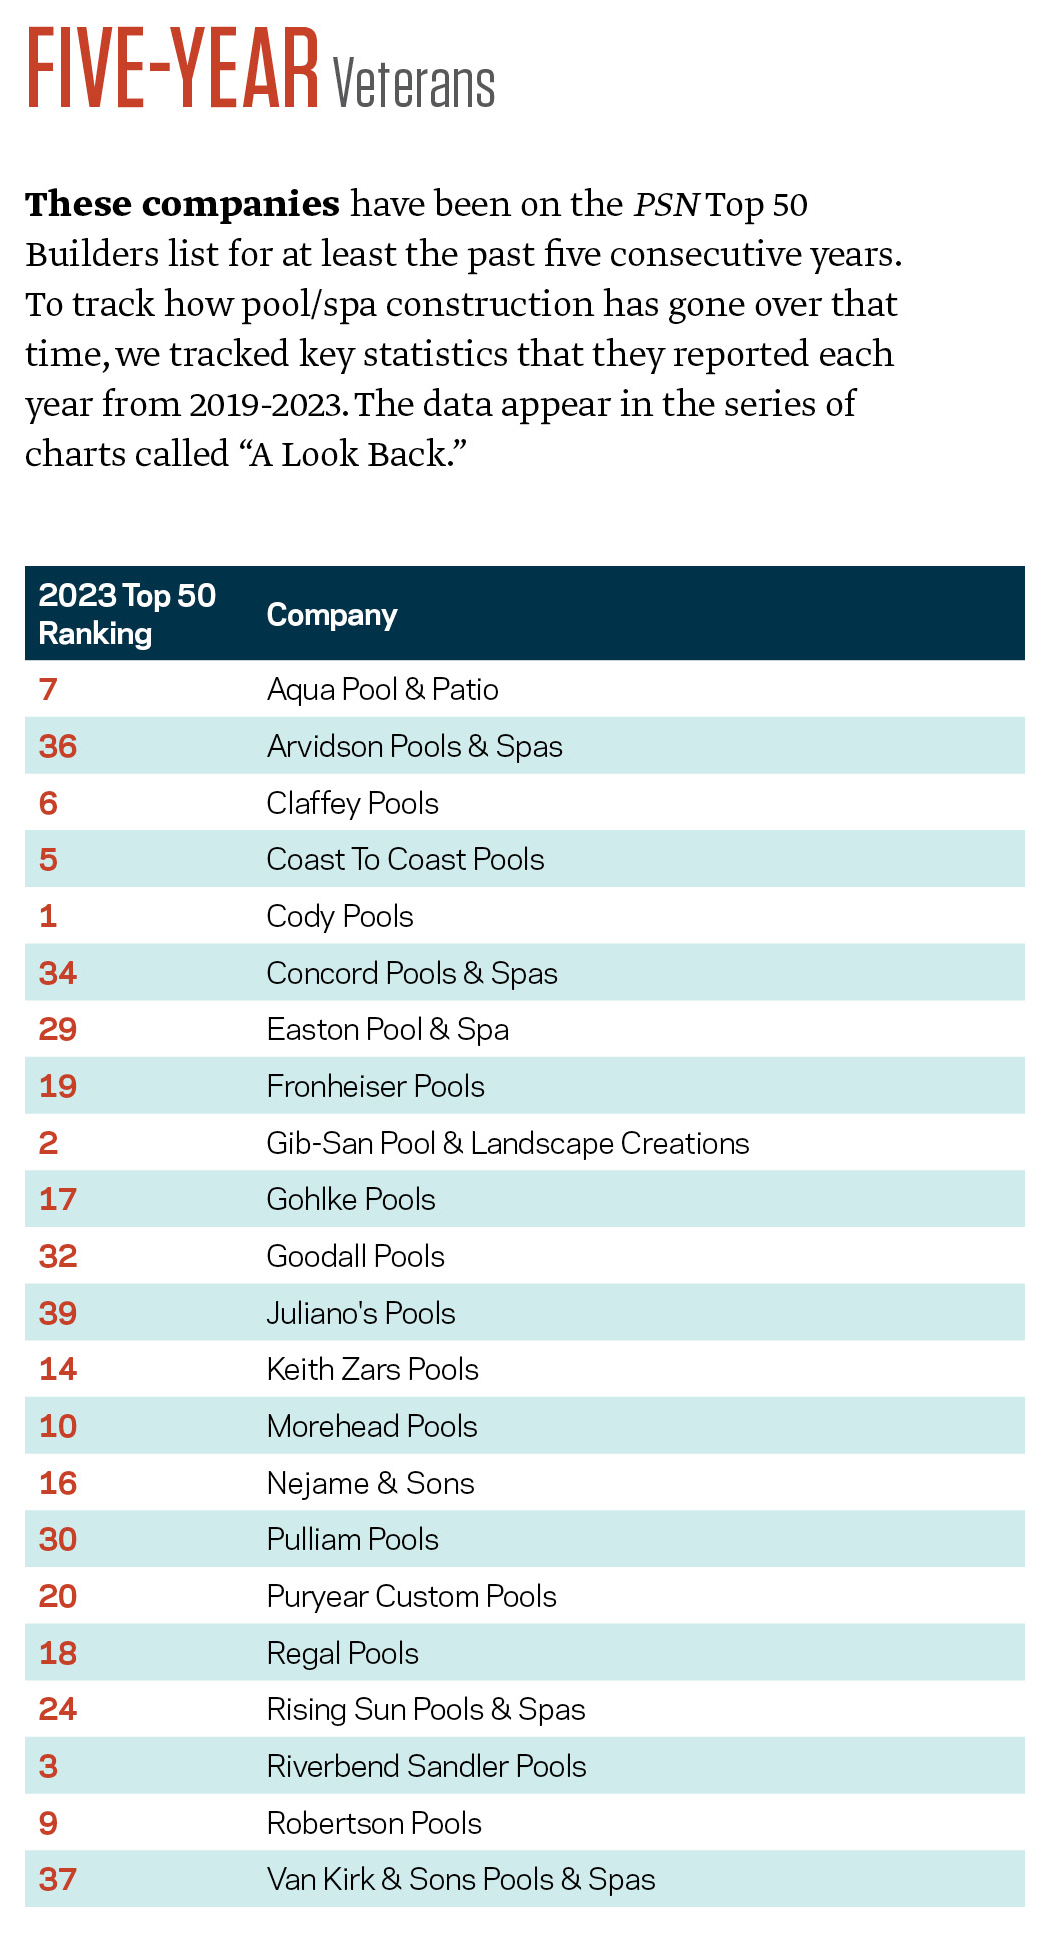
These companies have been on the PSN Top 50 Builders list for at least the past five consecutive years. To track how pool/spa construction has gone over that time, we tracked key statistics that they reported each year from 2019-2023. The data appear in the series of charts called “A Look Back.”
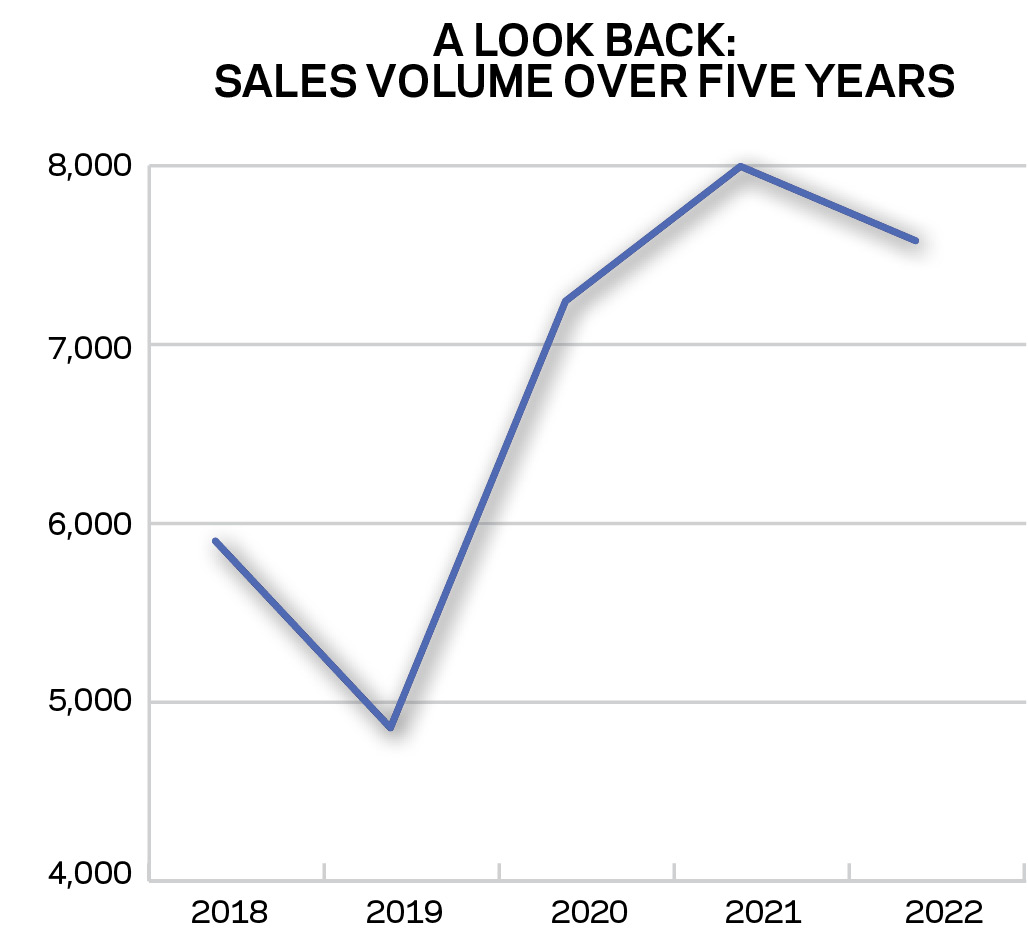
Not surprisingly, sales went up drastically beginning in 2020 for the group of Top 50 Builders that we’ve tracked over five years. Volume took a slight downturn last year.
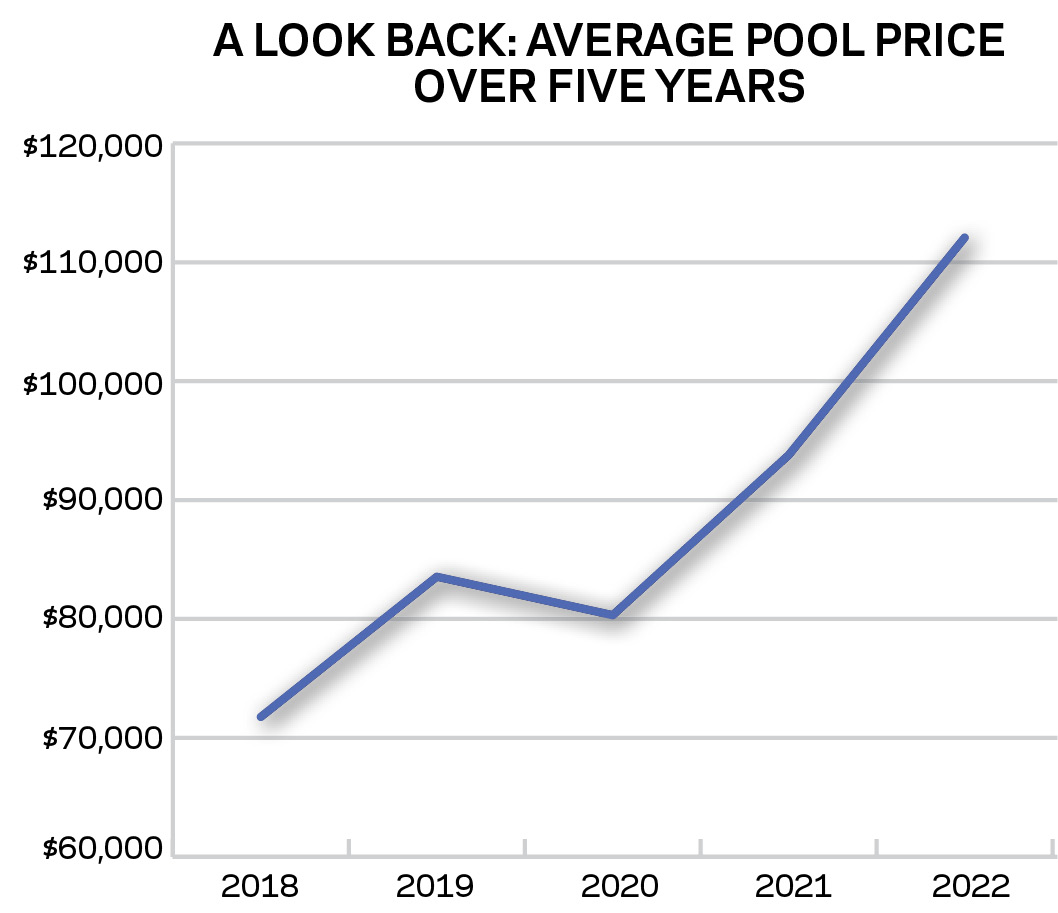
Average project prices have risen significantly, no doubt due to clients ordering more extensive projects, plus price increases.
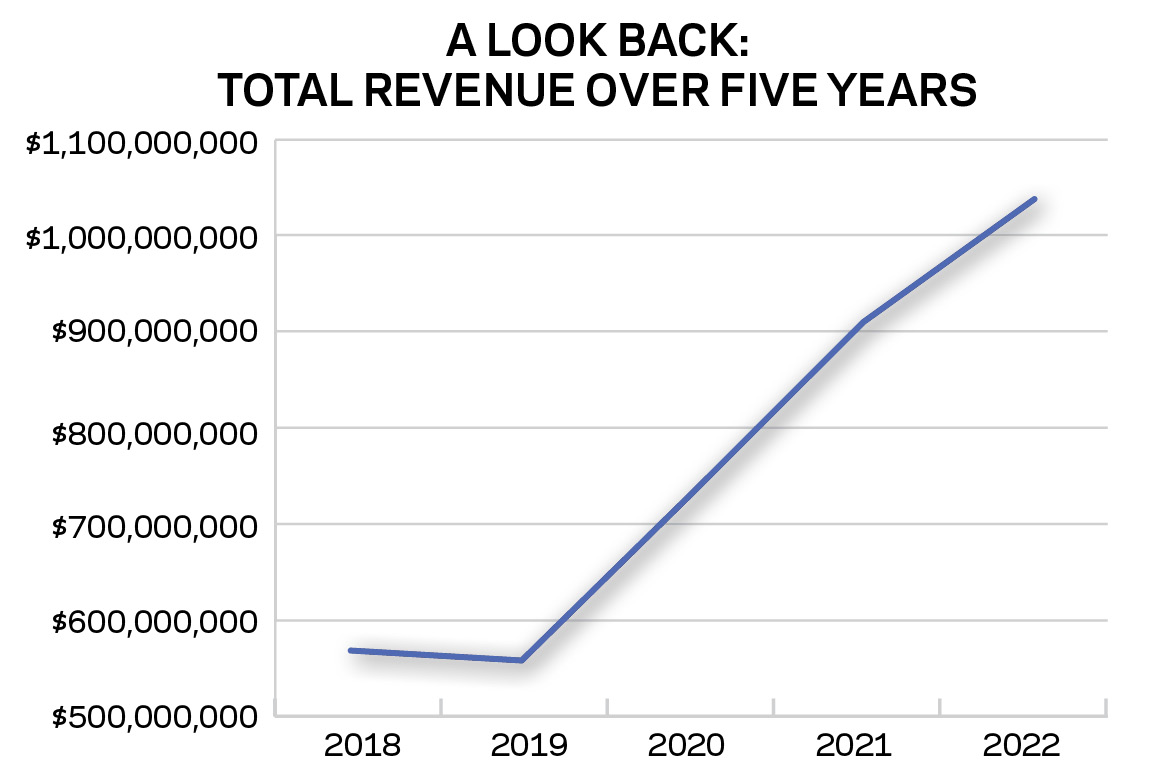
Here, we see the Total Revenues generated by companies who appeared on the last five PSN Top 50 Builders lists. This includes all departments, not just construction.
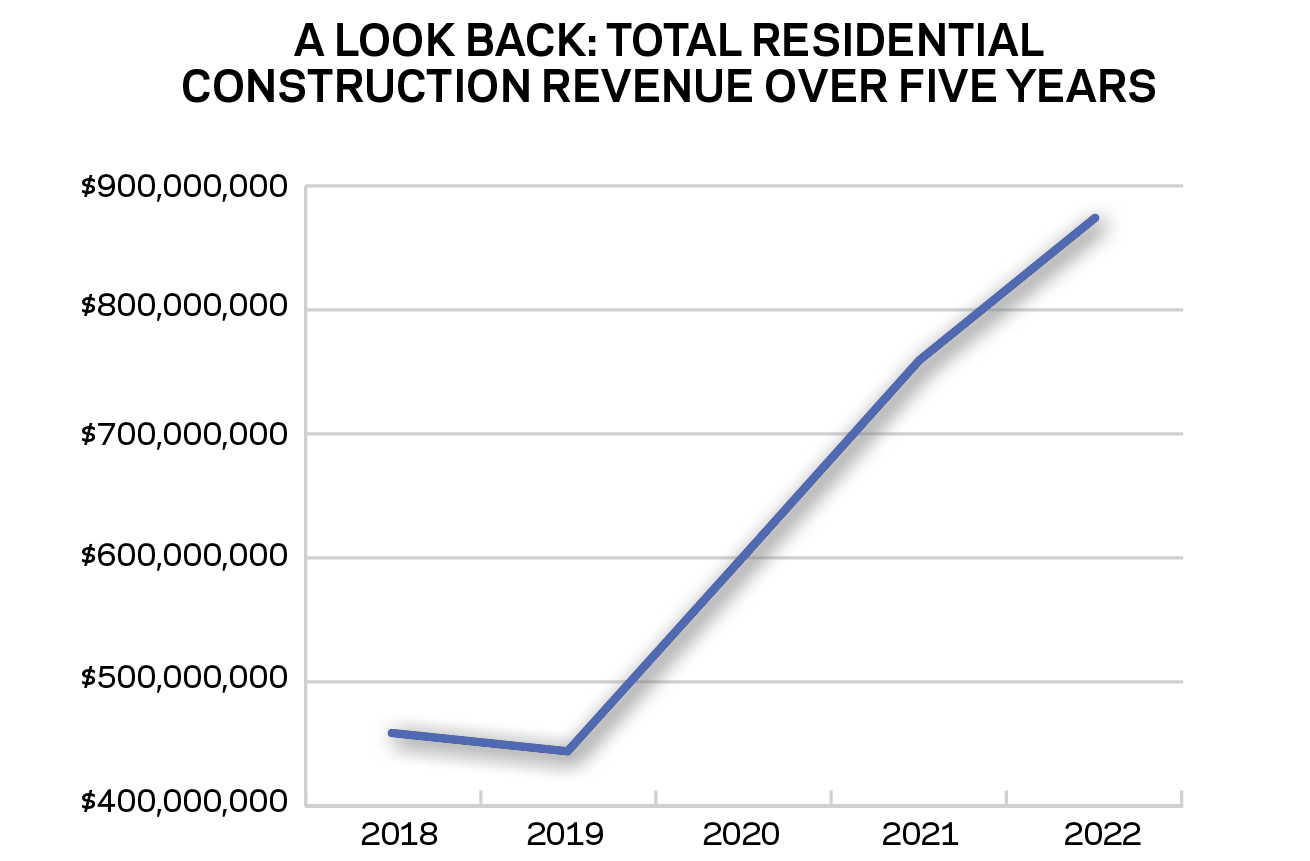
This chart tracks Total Residential Construction Revenue. These charts only include data from companies that appeared in the last five consecutive PSN Top 50 Builders lists, to provide a fair comparison.
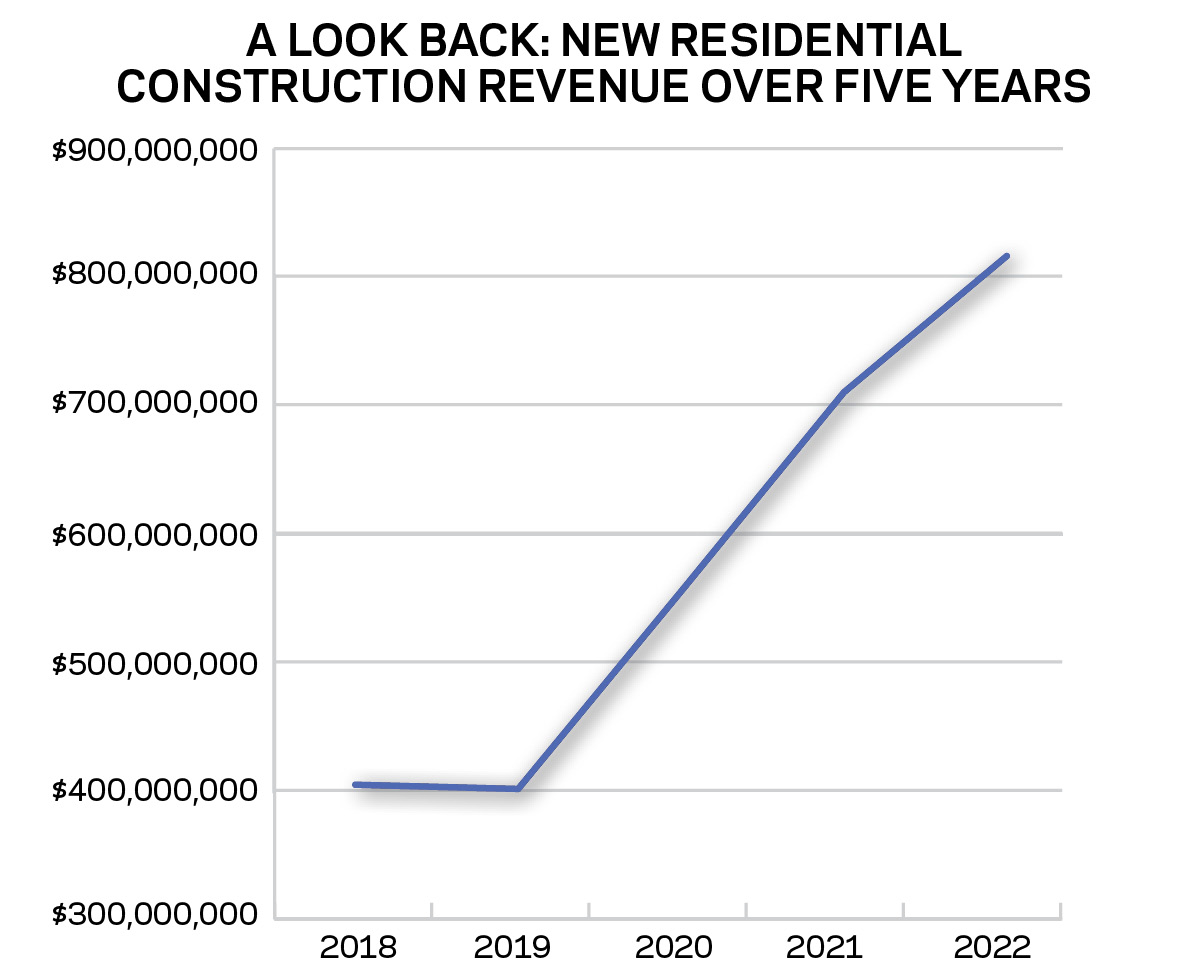
As with the other charts, new residential construction earnings jumped after 2019.
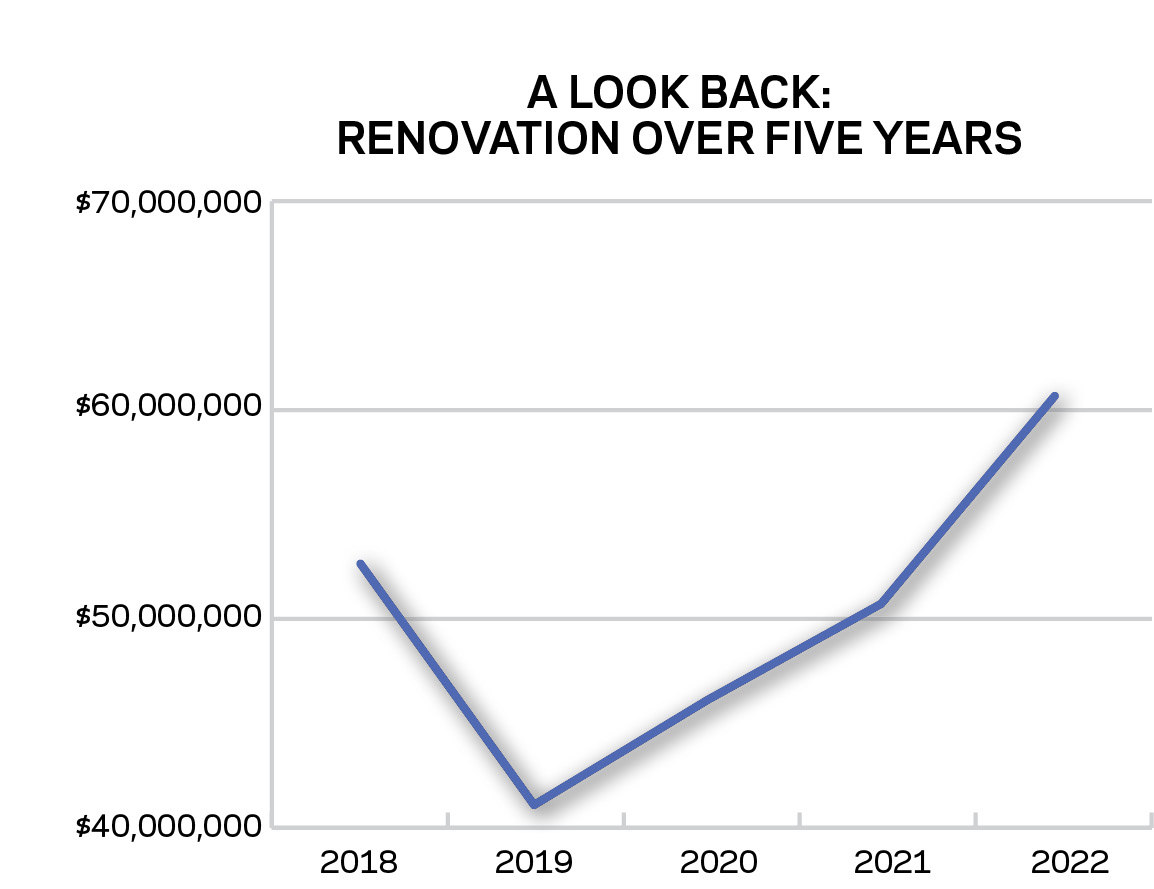
Here, we see renovation revenues earned by this group of builders over the years. These charts only include data from companies that appeared in the last five consecutive PSN Top 50 Builders lists, to provide a fair comparison.
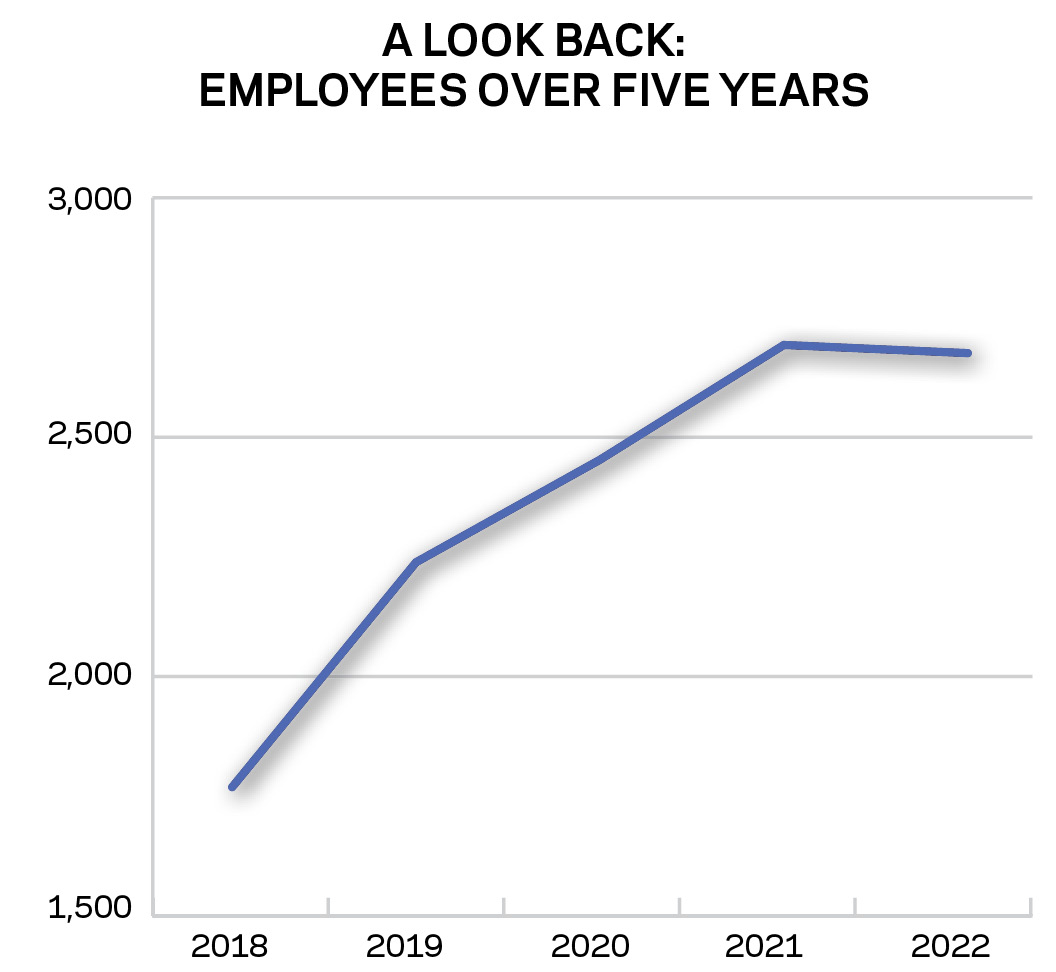
Staff sizes have not risen as drastically as the other metrics. This chart shows the number of permanent, full-time employees. These charts only includes data from companies that appeared on the last five consecutive PSN Top 50 Builders lists, to provide a fair comparison.