We wanted to see how our Top 50 Builders have done over the past few years.
This collection of charts, called “A Look Back,” is based on a sample of Top 50 builders. The sample was created by identifying those that appeared in each of the last five lists, allowing us to track the same group over time.
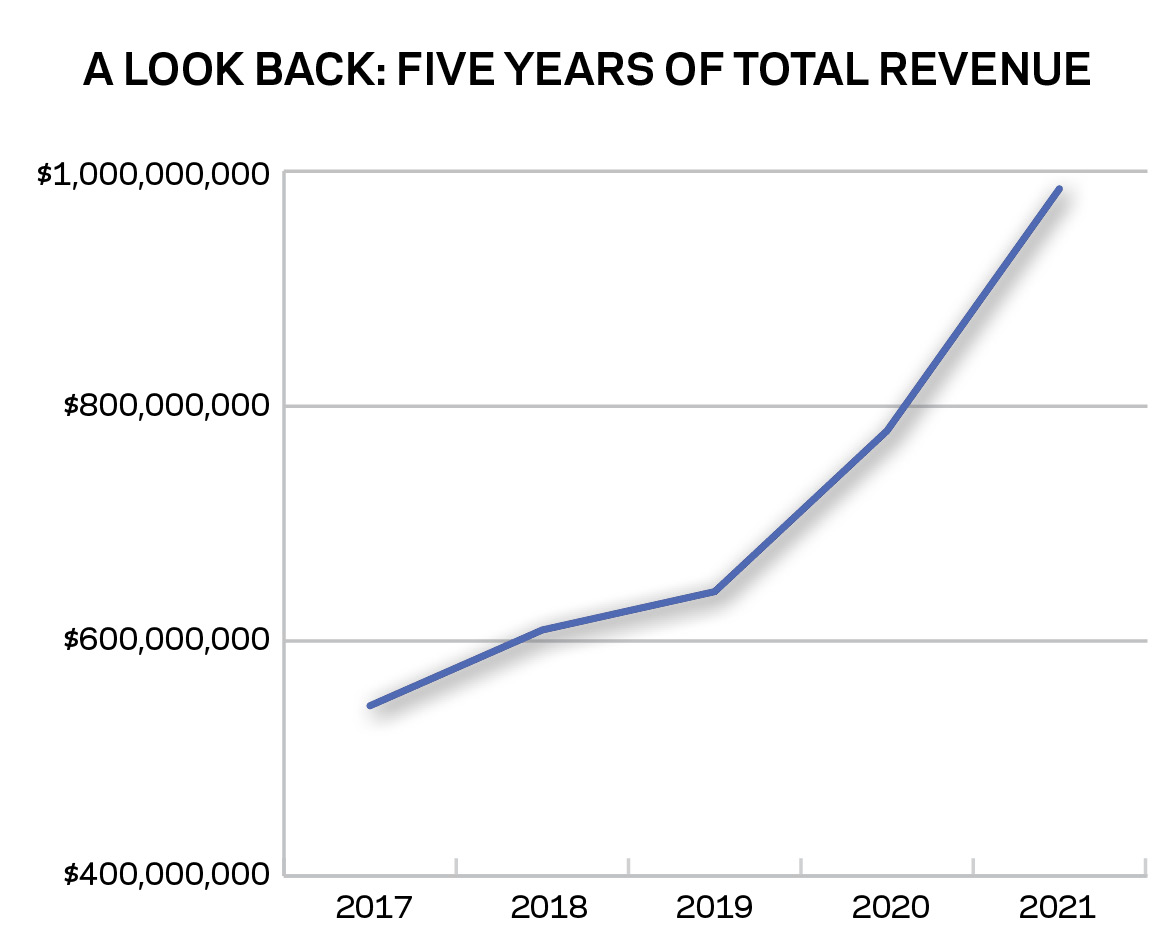
Here, we see their combined total revenues…
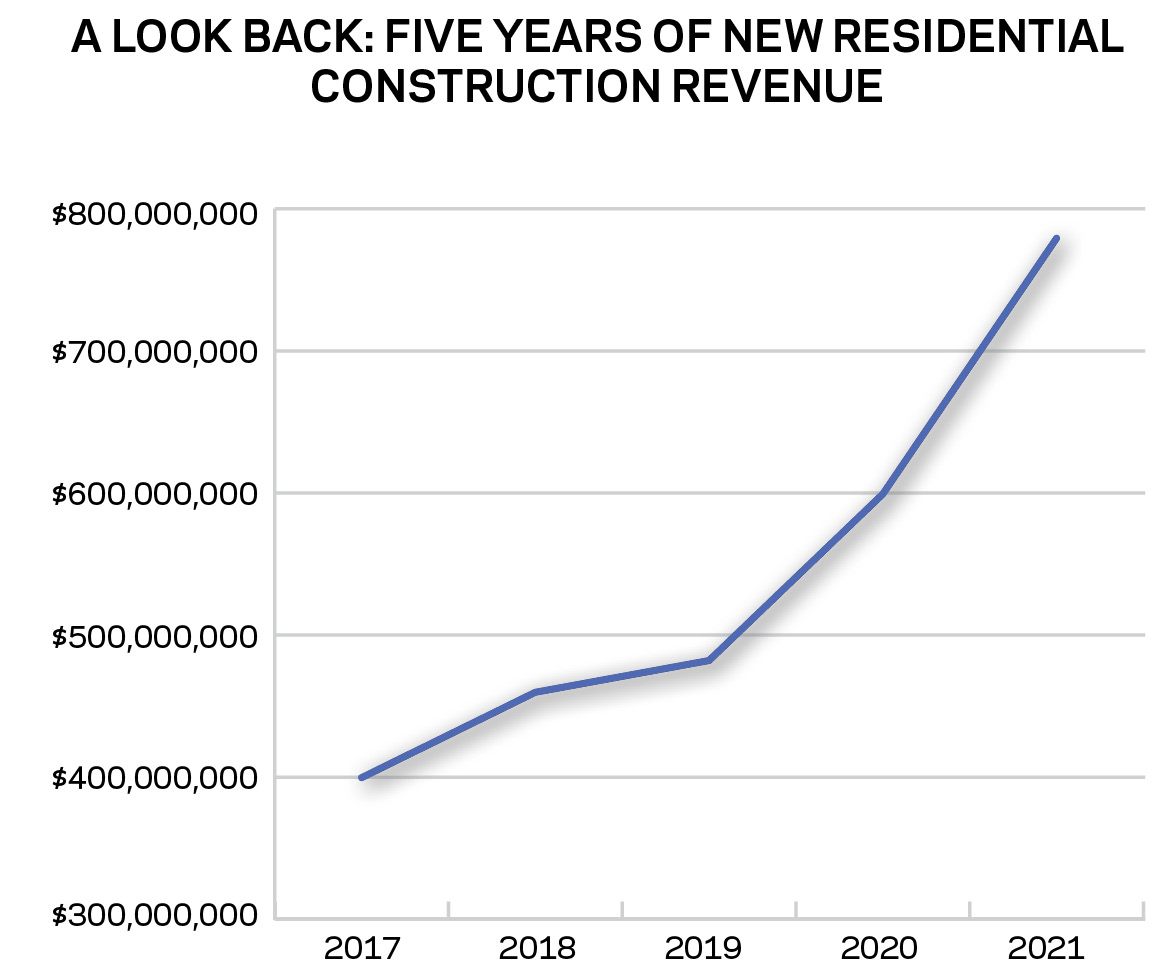
Like Total Revenue in the previous chart, this metric shows a precipitous upward curve, especially after 2019, the year before the pandemic hit. In 2021, this group reported nearly twice the new residential construction revenues they did in 2017.
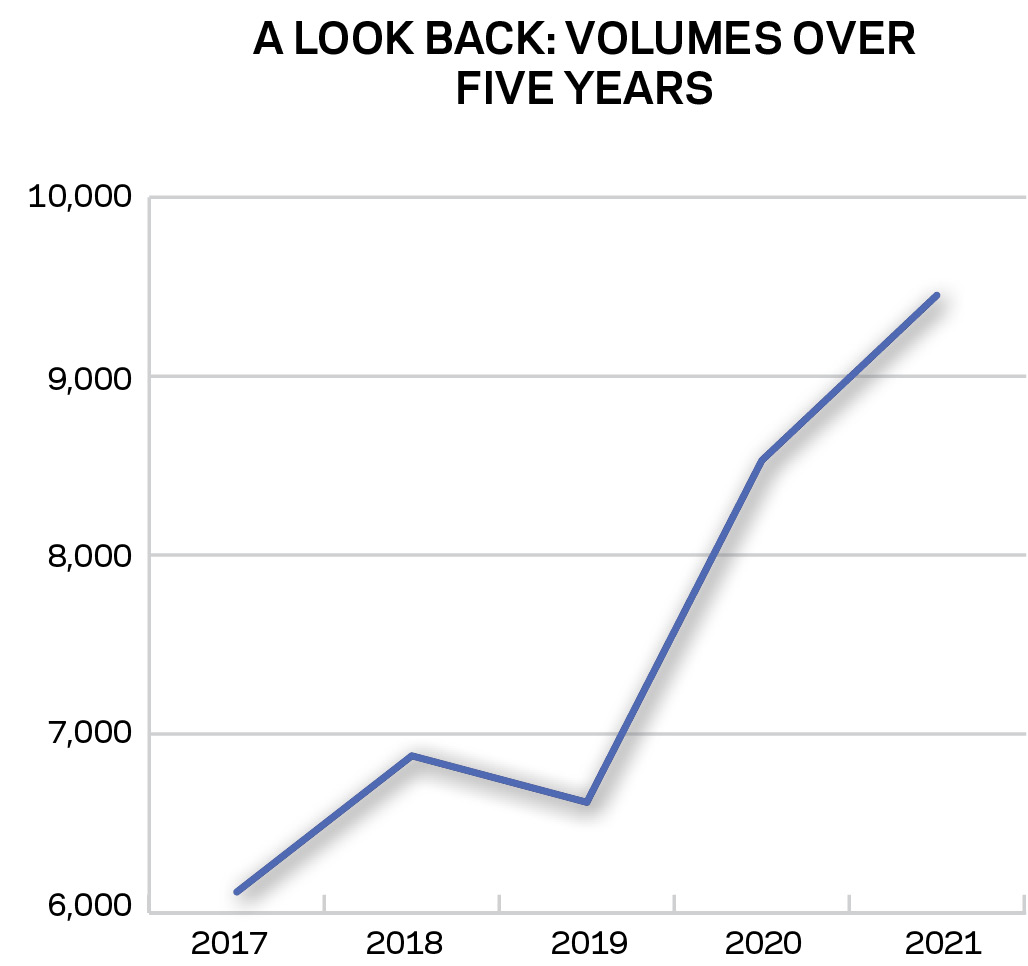
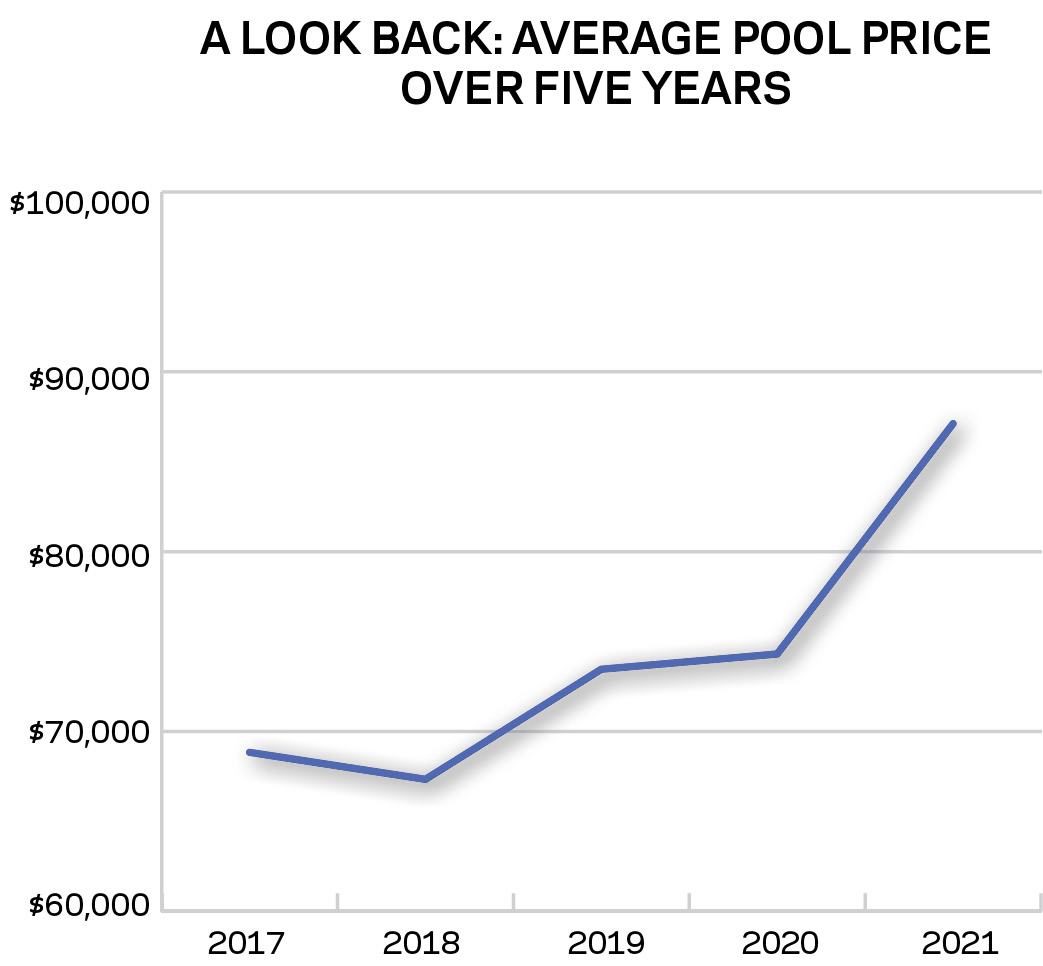
The chart to the left shows how many excavations were performed by the sample of Top 50 Builders we tracked. Volumes shot up after 2019. To the right, we see the average price of pools sold by the sample of builders. The sample was created by isolating builders who appeared on the list for each of those years, allowing us to compare like with like.
The chart to the left shows how many excavations were performed by the sample of Top 50 Builders we tracked. Volumes shot up after 2019. To the right, we see the average price of pools sold by the sample of builders. The sample was created by isolating builders who appeared on the list for each of those years, allowing us to compare like with like.