
Of course, we want to track the performance of the Top 50 Builders to show as a microcosm for the industry. However, as this list changes each year, it wouldn’t make for an accurate reflection of market fluctuations to simply compare the whole list, one year against the next. To fix that, we isolated all builders who have appeared on the list for at least the last five consecutive years. The group of 27 companies gave us a consistent sample that we could observe over the five years. Then we tabulated their numbers for each year from 2021 to 2025 and tracked them over the past half decade. The following charts reflect this subgroup’s trajectory from 2021 to 2025. Revenue amounts are shown in real-time dollars and 2021 dollars to remove the obscuring effects of inflation.
These charts are based on the companies that have appeared on the PSN and Hayward Top 50 Builders list every year since at least 2021: Cody Pools, Claffey Pools, Gib-San Pool & Landscape Creations, Shasta Pools, Keith Zars Pools, Riverbend Sandler Pools, Richard’s Total Backyard Solutions, Robertson Pools, Van Kirk & Sons Pools & Spas, Pulliam Pools, Aqua Pool & Patio, Regal Pools, Juliano’s Pools, Goodall Pools, Concord Pools & Spas, Easton Select Group, Heritage Pools, Seasonal World, Venture Custom Pools, Coast to Coast Pools, Fronheiser Pools, Rising Sun Pools & Spas, Gohlke Pools, Gibbons Pools, Adams Pool Group, Nejame & Sons, and High-Tech Pools.
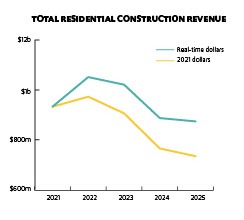
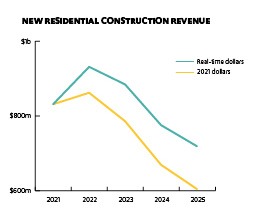
The green line shows real-time dollars, while the yellow represents 2021 dollars. Though the decline in residential construction revenue seems to be leveling off, the line representing 2021 dollars reveals a slightly steeper decline from 2024 to 2025 than it does in real-time dollars. However, new residential revenue, seen above right, has continued to drop more aggressively, regardless of the dollar valuation.
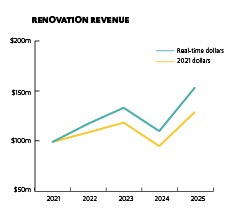
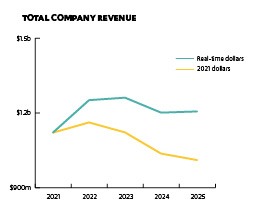
Renovation revenue amongst this group, seen above left, trends noticeably upward in both real-time and 2021 dollars. This appears to have helped temper the effects of the decline in new residential construction revenue when reflected in the charts showing total company revenue and total residential construction revenue.
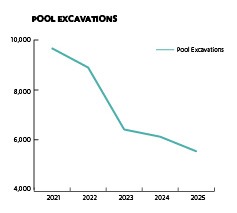
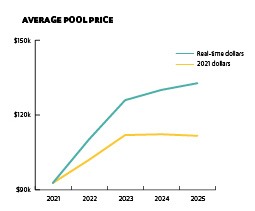
As to be expected, given the drop in new residential construction revenue, the number of excavations performed by this group, above left, has also turned down noticeably. Meanwhile average price per project, above right, has stabilized. When comparing prices in real-time dollars versus 2021 dollars, you can see the role that inflation has played.
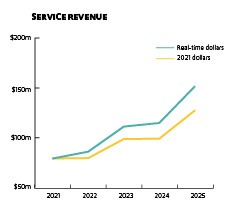
In just about every year, all but one builder reported earning service income, which shows an undeniable upward trajectory, above left.
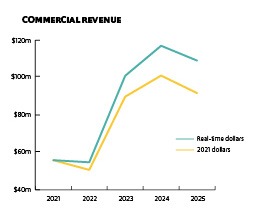
Commercial work, meantime, is showing similar trends as residential work now, as seen above right.