To succeed in business, a company must know its customers. In the case of the pool and spa industry, this means going beyond a simple understanding of overall numbers to actually learn about these consumers’ lives.
Using proprietary research, Hanley Wood Market Intelligence partnered with Claritas, a subsidiary of Nielsen, to gain a deeper understanding of the American homeowner.
The result was a series of up-to-date psychographic profiles describing the types of consumers that purchase a variety of products including pools and spas.
These easy-to-understand profiles can be leveraged to estimate demand and plan marketing strategies.
Here, we focus on the five specific consumer-types who are purchasing the highest number of pools, spas and waterfeatures.
Also to be found is new data that predicts what portion of future purchases these groups are expected to make. The figures were generated by Hanley Wood Market Intelligence based on a variety of sources including permit information.
Hanley Wood Market Intelligence is owned by Hanley Wood LLC, which is also the parent company of Pool & Spa News.
Who’s Buying Pools?
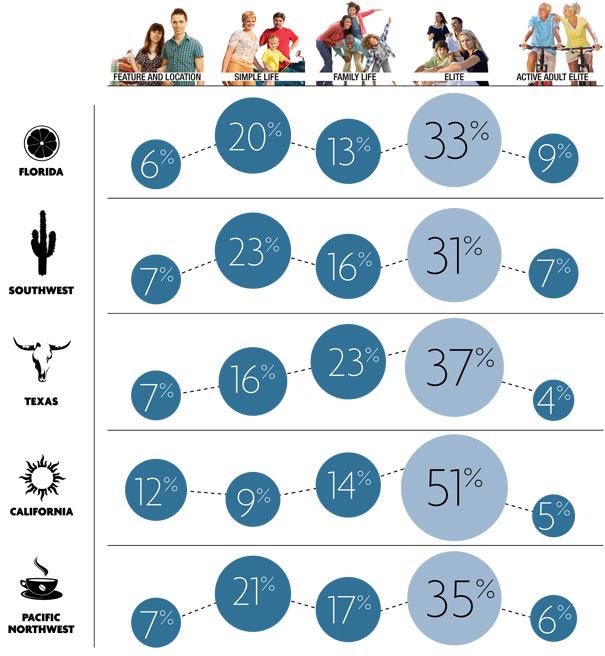
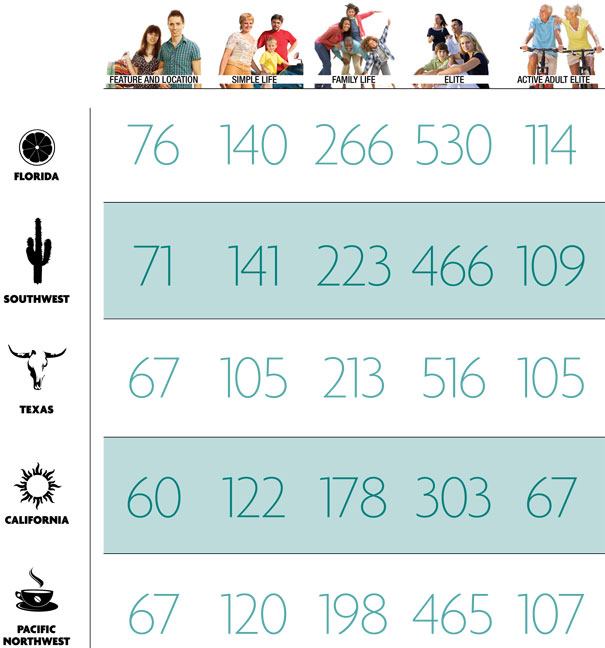
These five consumer groups purchase the most pools. Their buying activity is shown here. Percentages do not total 100, because only the groups with the most pool purchases are depicted. The bottom charts show the likelihood of each type to purchase. An index of 100 represents the average household. A 200 indicates a group is twice as likely to purchase, and 150 means the group is 50 percent more likely to buy.
TOTAL U.S. NEW HOME CLOSINGS SINCE 2009These percentages reflect the households that could be identified from permit information. TOTAL U.S. PERCENTAGE OF NEW POOL PROJECTSFigures represent purchases made between 2009 and Q1 2012. TOTAL U.S. LIKELIHOOD INDEX FOR NEW POOLSThese figures compare purchasing likelihood to the average household, represented by 100. Feature and Location: Young professional singles and couples focused on their careers. Most are 25 to 44 years old, earning $50K to $150K. Their homes are generally worth $200K to $500K. They appreciate custom features and may sacrifice basics to buy desired items. They are price-focused when it comes to technology and style. They value convenience over price.
Simple Life: Active singles, couples and families enjoying middle-class status. The heads of household range in age from 35 to 54. Less focused on career, they earn $50K to $100K. They have a high rate of homeownership in rural and suburban settings and enjoy outdoor activities.
Family Life: Traditional middle- to middle-upper-class families in mid-sized suburban homes. The homeowners are generally ages 35 to 54, college-educated, and earn $75K to $150K. They value features and a sense of community.
Elite: Affluent families and older couples, ranging in age from 35 to 64. Half have children at home and many have post-graduate degrees. Their homes are worth more than $500K. They value privacy, prestige, features, customization and options.
Active Adult Elite: Middle- to upper-class adults at retirement or close. They earn $75K to $150K and have an active, social lifestyle. Community and sense of place are important to them. They value stylish features, new construction and a community feel.
Percentage of New Pool Projects
The numbers below show what percentage of purchases each consumer group made in key markets. Numbers in each region will not add up to 100, since only the five most active customer groups are shown.
Likelihood Index for New Pools
This chart predicts the likelihood of each type of consumer to purchase a residential inground pool or spa. The numbers show a percentage comparison with the average household, which is represented by 100. A segment with an index of 200 is twice (or 200 percent) as likely as the average household to purchase, whereas a 150 means the group is 50 percent more likely to purchase than average.

